| | |
|
|
| Architosh News Reports | |
| Architosh Staff ([email protected]) |
| |
|
MacCAD-reView: VectorWorks ARCHITECT - Part 2
Table of Contents for this Review Series
reView: VectorWorks ARCHITECT - Part 1: Introduction and Setup
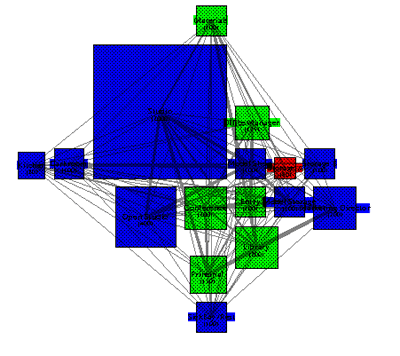
Part 2: Continued Below is the output bubble diagram of our program. Note that the complexity can be managed by not placing values in the adjacency diagram for each room-to-room interaction. This may have helped our program generate into a cleaner diagram, but we didn't go back and change these values.
In truth our values for adjacency were less considered than we might have done if this was a real project. Nevertheless, the above diagram (generated automatically) graphically represents our building program. Colors were assigned in the worksheet (Green for areas that are public related, like entry and conference; Blue for architect and design staff areas; and Red for janitorial storage). You have the option of determining the shape (rounded rectangle, etc.) of the program elements as well as the information shown in them. It is important to note that the placement of individual rooms is based on the adjacency matrix values and the room sizes. Thick gray lines denote adjacencies with more dependence, thin lines with less. Sometimes -- as shown above -- some highly dependent rooms get placed remotely from each other due to the order of other dependencies. We haven't played around with this extensively to have figured out exactly how this works, but it appears that if one room has extensive high level dependencies on adjacent rooms it will be placed closer to the largest number of rooms who have stronger dependencies with it and each other. Of course having a computer program generate a bubble diagram for you is of limited value unless you are able to go back-and-fourth with the data (in the worksheet) and interact with the bubble diagram itself. And that is just what VectorWorks ARCHITECT provides.
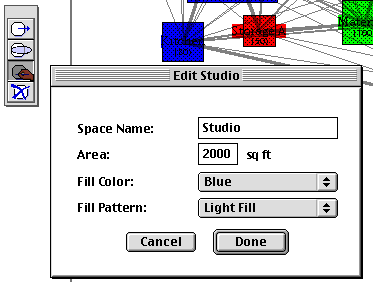
In the image above you may note the tool bar on the upper left. These four tools allow you to move, reshape, re-note values, and delete individual programming elements. When you select the third tool (shown above) and select a program room a window dialog box appears and allows you to edit the values which were placed in the original programming worksheet. This is better than going back to the worksheet itself. However, if you want to add a room, there is no corresponding tool in this palette and you are forced to go back to the worksheet. There is a reason for this: the worksheet is where you assign adjacency matrix values for all the elements in the program. [Besides the bubble diagramming features, ARCHITECT can also do Draw Stacking diagrams which represent the same programming worksheet information on a vertically oriented (section) diagram. This type of diagram allows you to see if you have under or over allocated too much program to individual floors and allows you to visually understand the relationships of rooms vertically in the program.] Conclusion These tools will no doubt excite some and appear of little value to others. Many architects today don't design with "bubble diagrams" anymore but rely on different techniques for visual representation and design strategy. In fact, this is "programming school" design theory tools here and while they may have been popular in the 60' and 70's, since Colin Rowe's seminal essay "Program versus Paradigm", many architects and professors of architecture subscribe to different methods of testing architectural programs and working with this information in the early stages of design. [However, as Colin said himself, between these two (program versus paradigm) lies a more suitable approach to design methodology at this point in the design process. These tools in VectorWorks ARCHITECT can serve, at the minimum, as an optional testing ground for program configuration studies and it is very useful to let the computer generate that first diagram from which you can proceed. Certainly with very large programs it would be invaluable to see what the computer will do given the objective (necessarily subjective and arbitrary, according to Colin) data, and a thorough study of that product may reveal informative and insightful information.] Next Part In Part 3 we will show you a refined (edited) bubble diagram for our project and how it was conditioned by the site criteria. We will also show you some hand sketches and get into how VectorWorks ARCHITECT allows you to draw using the new Task Manager (if we said last time it was a mistake, it will happen in Part 3). Till then... [Editor's note: this article was update briefly at 8:50 am, EST] Other Architosh News and Special Reports Architosh Seybold Report: Mac products for CAD/AEC - Part 1 solidThinking 3D app coming to Mac OS 9 and OS X VersaCAD returning to the Macintosh! iDisk to be powerful tool for AEC and "design pros"
| |||||||||
| Feedback | Back to Architosh News |
| |
|
|
| |
|
| |
|
| |